Solving Complex Computer Network Assignments Using Cisco Packet Tracer

- 1. Understanding the Requirements
- 2. Measuring Network Performance
- 3. Calculating the Bandwidth Delay Product (BDP)
- 4. Capturing Packets Using Wireshark
- 5. Analyzing TCP Window Size and Options
- 6. Examining TCP Performance Using Time-Sequence Graphs
- 7. Evaluating Throughput and Packet Loss
- 8. Interpreting Wireless Network Performance
- 9. Identifying and Addressing Network Issues
- 10. Writing a Detailed Report
- Conclusion
Computer network assignments often involve analyzing network traffic, evaluating throughput, and using tools like Wireshark to capture and interpret packet data. These tasks require a deep understanding of networking principles, along with hands-on expertise in monitoring and troubleshooting network performance. Students seeking computer network assignment help often struggle with complex concepts like TCP handshakes, bandwidth delay products, and selective acknowledgments. A well-structured approach is essential for tackling these assignments, starting with gathering network performance metrics through tools like Speedtest.net and then capturing live packet flows using Wireshark. By interpreting TCP sequence graphs, students can assess issues such as packet loss, congestion, and retransmission rates. Moreover, understanding key networking protocols, including TCP/IP, helps in diagnosing performance bottlenecks and optimizing data transmission. In addition to Wireshark, many assignments require using Cisco's Packet Tracer, a crucial tool for simulating real-world network scenarios. For students needing help with packet tracer assignment, grasping the fundamentals of network topology, device configurations, and protocol interactions is crucial. Assignments may involve setting up a virtual network, configuring routers and switches, and analyzing packet exchanges to ensure proper data flow. Additionally, wireless network analysis often forms a significant part of these assignments, requiring students to differentiate between wired and wireless throughput behaviors. Identifying issues like high round-trip times, small TCP window sizes, and frequent retransmissions is key to optimizing performance. A structured methodology, including thorough documentation of findings, visual representation of network behavior through graphs, and well-explained calculations, ensures a comprehensive approach to solving these assignments. Whether working on packet analysis, network simulations, or performance troubleshooting, leveraging the right tools and methodologies is essential for mastering computer networking concepts and successfully completing assignments.
1. Understanding the Requirements

Successfully solving a computer network assignment begins with thoroughly understanding the given requirements. Carefully reviewing the assignment instructions helps identify key tasks, tools, and expected outcomes. Many network assignments involve analyzing traffic, measuring network parameters, and using specialized tools like Wireshark or Packet Tracer. Defining the scope of work early on ensures that no critical aspect is overlooked. Additionally, it is essential to clarify objectives such as evaluating TCP behavior, measuring throughput, or diagnosing performance bottlenecks. Properly interpreting the requirements lays the foundation for accurate analysis and precise reporting, ultimately leading to a well-structured and comprehensive submission. Before starting, carefully read the assignment instructions. Computer network assignments typically include:
- Using a web service to measure network performance (e.g., speed test)
- Capturing packets using Wireshark
- Analyzing TCP behavior, including the Bandwidth Delay Product (BDP) and TCP window size
- Examining throughput and packet loss
By identifying the key components early, you can efficiently plan your approach.
2. Measuring Network Performance
Measuring network performance is a critical step in analyzing connectivity and efficiency. This process typically involves using tools like Speedtest.net to determine parameters such as round-trip time (RTT), download and upload speeds, and latency. These metrics provide insights into the overall health of the network and its responsiveness under different conditions. RTT, for instance, helps gauge the time taken for a data packet to travel to a remote server and return, while bandwidth measures the rate of data transmission. Understanding these parameters is essential for evaluating a network’s capability, detecting bottlenecks, and ensuring optimal performance for various applications. Many assignments require using an online speed test service to measure network latency and bandwidth. The key parameters to note include:
- Round-Trip Time (RTT): The time it takes for a packet to travel to a destination and back.
- Download Speed: The rate at which data is received from the server.
- Upload Speed: The rate at which data is sent to the server.
Once these values are obtained, they help in further calculations such as BDP.
3. Calculating the Bandwidth Delay Product (BDP)
The Bandwidth Delay Product (BDP) is a fundamental metric in networking that determines the amount of data that can be in transit within a network at any given time. It is calculated using the formula:  , where bandwidth is measured in bits per second and RTT in seconds. A higher BDP indicates a network capable of handling more data in transit without congestion. Understanding BDP is essential for optimizing TCP window sizes and improving data transfer efficiency. In practical applications, BDP helps network engineers configure buffer sizes and window scaling to ensure maximum throughput and minimal packet loss. The BDP is a crucial parameter in network performance, calculated using:
BDP = Bandwidth × RTT
where bandwidth is in bits per second and RTT is in seconds. The BDP represents the amount of data that can be in transit before an acknowledgment is received.
For example, if the bandwidth is 50 Mbps and the RTT is 50 ms (0.05 sec), then:
BDP = 50,000,000 × 0.05 = 2,500,000 bits (or 312,500 bytes).
BDP is essential in understanding TCP window size settings and optimizing network performance.
4. Capturing Packets Using Wireshark
Wireshark is a powerful tool for capturing and analyzing network packets, allowing users to inspect network behavior in real-time. To capture packets effectively, users must select the correct network interface, start a capture session, and initiate a relevant network activity such as a file download or website request. Once the capture is complete, the collected data can be filtered to focus on specific protocols, such as TCP or HTTP. Analyzing captured packets provides valuable insights into connection establishment, data flow, retransmissions, and errors. This step is crucial for diagnosing performance issues, detecting security threats, and understanding traffic patterns in a network. Wireshark is a powerful tool for network packet analysis. To capture packets effectively:
- Start Wireshark and select the network interface (e.g., Wi-Fi or Ethernet).
- Begin capturing packets and initiate a network action (such as downloading a file from a given URL).
- Stop the capture once the download completes.
After capturing the packets, focus on the TCP handshake and data transmission patterns.
5. Analyzing TCP Window Size and Options
TCP window size plays a vital role in controlling data flow between sender and receiver, ensuring efficient communication while preventing congestion. The initial window size is set during the TCP handshake and determines how much data can be sent before receiving an acknowledgment. Wireshark allows users to inspect TCP window size values and window scaling options, which help optimize network throughput. A larger window size is beneficial for high-bandwidth, high-latency connections, as it minimizes the waiting time for acknowledgments. Understanding TCP window size adjustments is essential for maintaining network efficiency, preventing congestion collapse, and improving data transmission rates. The initial TCP window size determines how much data can be sent before receiving an acknowledgment. It is found in the SYN packet of the TCP handshake. To analyze it:
- Locate the first TCP SYN packet in Wireshark.
- Expand the TCP header to find the Window Size Value.
- Consider the Window Scale Factor, if present.
Compare the computed BDP with the window size to determine if the sender is utilizing the available bandwidth efficiently.
6. Examining TCP Performance Using Time-Sequence Graphs
Wireshark provides a powerful tool for visualizing TCP performance through Time-Sequence graphs, which display the flow of data during a TCP connection. To generate a Time-Sequence graph in Wireshark, users must follow a TCP stream and navigate to Statistics > TCP Stream Graph > Time/Sequence Graph. This graph highlights critical events such as retransmissions, congestion, and bursts in the data flow. Key observations from the graph include drops to zero in the window size, which suggest network congestion or flow control issues, and bursts that indicate intermittent transmission, which may point to bandwidth limitations or network instability. Packet losses are also visible as gaps in the sequence, further confirming issues in data transmission. By closely analyzing the graph, students can identify patterns that impact network performance and take corrective actions to optimize the data flow. Wireshark allows visualization of TCP performance using Time-Sequence graphs. To generate one:
- Follow a TCP Stream in Wireshark.
- Navigate to Statistics > TCP Stream Graph > Time/Sequence Graph (tcptrace).
- Observe trends such as bursts, retransmissions, and congestion events.
Key observations to make:
- Are there drops to zero in the window size? This indicates congestion or flow control.
- How many TCP bursts are visible? More bursts suggest intermittent transmission.
- Are packet losses visible? These appear as sudden gaps in the sequence graph.
7. Evaluating Throughput and Packet Loss
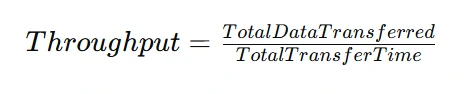
Throughput and packet loss are crucial metrics in evaluating network performance. Throughput measures the amount of data successfully transferred over a network within a given time period, and it is calculated by dividing the total data transferred by the total transfer time. Packet loss, on the other hand, occurs when data packets fail to reach their destination, often leading to retransmissions. Using Wireshark, students can identify packet loss by looking for TCP Selective Acknowledgments (SACKs), missing sequence numbers, and the occurrence of retransmissions. By examining these indicators, students can calculate throughput and assess the efficiency of data transmission. High packet loss can be a sign of network congestion, hardware issues, or interference, and optimizing throughput may require fine-tuning TCP parameters, such as the window size or adjusting network configurations to prevent congestion. It is calculated as:
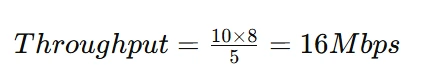
For example, if a file of 10 MB is downloaded in 5 seconds, then:
To evaluate packet loss:
- Identify TCP Selective Acknowledgments (SACKs) in Wireshark.
- Look for missing sequence numbers in the data stream.
- Count the number of retransmissions, which indicate lost packets.
8. Interpreting Wireless Network Performance
Wireless network performance analysis often differs from wired networks due to the impact of environmental factors like interference, signal strength, and range. When analyzing wireless network performance with Wireshark, students should pay attention to differences in throughput between wired and wireless transmissions, which can be influenced by signal quality and network congestion. Increased packet delays and retransmissions in wireless networks may indicate weak signals, interference, or network congestion. By analyzing the timestamps of specific bursts in the capture, students can calculate throughput and evaluate the efficiency of wireless transmission. For instance, if 500 KB of data is transmitted within a time interval of 0.081734 seconds, students can compute the throughput, revealing performance bottlenecks. Understanding these nuances helps students address issues in wireless networks and optimize performance.Some assignments involve analyzing Wireshark .pcap files containing wireless network captures. Important points to check:
- The difference in throughput between wired and wireless transmissions.
- Additional packet delays and losses due to wireless interference.
- Increased TCP retransmissions caused by weaker signals.
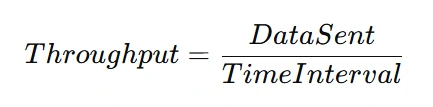
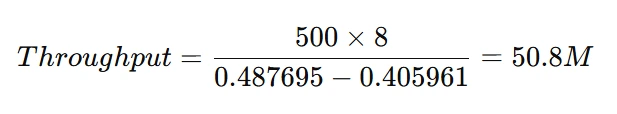
When analyzing a specific burst within the capture, use timestamps to calculate throughput. For example, if a burst occurs between 0.405961s and 0.487695s, throughput is calculated as:
For example, if 500 KB was sent during this period:
This helps compare different parts of the transmission.
9. Identifying and Addressing Network Issues
Identifying and addressing network issues is a critical aspect of network performance troubleshooting. Common issues include high round-trip times (RTT), which can signal network congestion or long-distance routing problems, and small TCP window sizes that limit throughput by restricting the amount of data that can be in transit at once. Frequent packet loss is another problem, often caused by network interference, congestion, or hardware malfunctions. These issues can be diagnosed using tools like Wireshark, where high RTTs and retransmissions point to underlying problems. To resolve these issues, students may need to adjust TCP settings, such as increasing the window size or tuning other parameters to improve throughput. Network optimization may also involve troubleshooting physical network components, upgrading hardware, or reconfiguring network settings to enhance stability and efficiency. Based on the analysis, common network issues might include:
- High RTT values: Indicating network congestion or long-distance routing.
- Small window sizes: Reducing throughput and requiring tuning.
- Frequent packet loss: Suggesting interference, congestion, or hardware issues.
Optimizing TCP settings, increasing window sizes, or troubleshooting physical network issues can resolve these problems.
10. Writing a Detailed Report
A detailed report is an essential component of any network performance analysis. Students should document their findings clearly and concisely, providing screenshots of Wireshark captures, TCP sequence graphs, and throughput calculations. The report should include key network parameters such as RTT, throughput, packet loss, and TCP window size, with a thorough explanation of observed trends and behaviors. Visual aids, such as graphs and tables, help enhance the clarity of the report, making it easier for the reader to understand complex data. Students should also provide recommendations for optimizing network performance based on their analysis, such as adjusting TCP window size, optimizing routing paths, or resolving congestion issues. A well-organized and comprehensive report ensures that all critical aspects of the assignment are covered, demonstrating the student's understanding and ability to apply network analysis techniques. Finally, document all findings systematically:
- Include screenshots of Wireshark captures.
- Clearly state observed values (RTT, throughput, packet loss, TCP window size).
- Interpret graphs and numerical calculations.
- Provide explanations for network behavior and optimization strategies.
A well-structured report enhances clarity and ensures the completeness of the assignment.
Conclusion
Successfully solving computer network assignments involves a combination of theoretical knowledge and practical skills, particularly when dealing with packet analysis, throughput evaluation, and TCP performance assessment. By leveraging tools like Wireshark and Packet Tracer, students can analyze real-world network behavior, diagnose issues, and optimize performance. Understanding key concepts such as TCP window size, RTT, BDP, and throughput is essential for assessing and improving network efficiency. Whether working on wired or wireless networks, students must adopt a systematic approach to analyzing data, identifying issues, and addressing performance bottlenecks. A well-documented report, supported by data visualizations and clear explanations, is critical to communicating findings and demonstrating proficiency in network troubleshooting.